Ever tried to plan a long road trip without looking at a map or checking the weather? It’s a recipe for disaster. That's exactly what running a business without a sales forecast feels like.
At its core, a sales forecast is your best-educated guess about how much revenue your company will bring in over a specific period—be it a month, a quarter, or a year. It’s not about wishful thinking or pulling numbers out of thin air. Instead, it’s a calculated estimate grounded in things you already know: your past sales performance, current market trends, and what's currently sitting in your sales pipeline.
What Is a Sales Forecast and Why It Matters

Think of it this way: your sales goal is the mountaintop you're aiming to climb. It’s ambitious and aspirational. Your sales forecast, on the other hand, is your GPS. It tells you where you’re most likely to end up based on your current pace, the terrain ahead, and the supplies you have.
Without that forecast, you’re just hoping for the best. With it, you can turn vague ambitions into a concrete plan, allowing you to make strategic moves instead of just reacting to whatever comes your way.
The Strategic Value of Accurate Forecasting
A solid sales forecast isn't just a number for the leadership team to glance at. It’s a strategic tool that benefits the entire company. When you have a realistic picture of your future revenue, every department can make smarter, more aligned decisions.
This is the difference between driving with your eyes on the road ahead versus constantly looking in the rearview mirror. It gives you the power to anticipate challenges and opportunities instead of just responding to them after the fact.
A robust sales forecast is the cornerstone of sustainable business growth. By providing a clear picture of expected revenue, companies can make informed decisions about expansion, hiring, and investment.
To boil it down, here's a quick look at what a sales forecast is all about.
Sales Forecasting at a Glance
| Component | Description |
|---|---|
| Who Creates It? | Typically led by a Sales Manager or Head of Sales, with input from individual sales reps. |
| What's Inside? | Estimated revenue, sales volume, and deal velocity over a defined period (e.g., month, quarter). |
| Why Does It Matter? | Informs crucial business decisions like hiring, budgeting, resource allocation, and risk management. |
This table captures the essence of forecasting, but the real impact comes from putting it into practice.
Key Benefits for Your Business
For small and medium-sized B2B teams—especially those with long sales cycles and high-stakes deals—a reliable forecast isn't just nice to have; it's essential.
Here’s a breakdown of the real-world advantages:
- Improved Decision-Making: It gives you the confidence to pull the trigger on a new hire, greenlight a marketing campaign, or invest in product development because you’re not just guessing about future cash flow.
- Better Resource Allocation: When you know what’s coming in, you can manage your money more effectively. You avoid overspending on a whim or, just as damaging, under-investing in areas that could fuel growth.
- Proactive Risk Management: Is your forecast showing a potential slump next quarter? Great. Now you have time to do something about it, like launching a new promo or tasking your team with re-engaging old leads.
- Enhanced Team Alignment: It gets everyone on the same page. When sales, marketing, operations, and finance are all working off the same numbers, the entire business moves in sync.
Ultimately, mastering your sales forecast gives you a sense of control. It helps your team move beyond guesswork, letting you manage performance with a clear system built on the clean, organized data you already have in your B2B CRM.
4 Core Sales Forecasting Methods to Know
Once you’ve wrapped your head around what a sales forecast is, the next big question is how to actually build one. There’s no single, perfect formula here. The right method for you really depends on your business stage, what kind of data you have on hand, and what you’re trying to achieve.
Think of these methodologies as different lenses you can use to look at your future revenue. Some start with the big picture and work their way down, while others build up from the ground level, deal by deal. Let's break down the most common approaches so you can find the one that gives your team the clearest view.
The Top-Down Approach
Top-down forecasting starts with the entire universe of potential customers—your Total Addressable Market (TAM)—and then carves out your expected piece of the pie. It’s a bit like a baker looking at the population of a whole city and estimating how many people they can realistically get to buy their bread.
First, you figure out the total market size. From there, you estimate the market share you can capture based on your product, competition, and marketing muscle. This approach is a go-to for new businesses or companies launching a new product, mainly because they don't have years of sales history to lean on.
While it's great for getting a high-level, "blue sky" number, its main risk is being overly optimistic. It answers the question, "What's our biggest possible potential?" before asking, "What can we realistically achieve right now?"
The Bottom-Up Approach
On the complete opposite end of the spectrum is the bottom-up forecasting method. This one starts with the individual deals already in your sales pipeline. You're essentially building a wall one brick at a time. Each "brick" is a potential sale, and by stacking them all up, you get a solid picture of the finished wall—your total forecast.
This is a favorite for B2B teams with a well-defined sales process. Your reps go through their pipeline, evaluate each opportunity, and assign a probability of closing based on where it is in the sales cycle. Add up the weighted value of every deal, and you have a forecast grounded in reality.
The bottom-up method is so powerful because it’s built directly from the tangible data sitting in your CRM. It gives you a real-time pulse on your pipeline's health and puts your reps in the driver's seat, making them accountable for their piece of the forecast.
Just remember, this approach is only as good as your data. It relies heavily on a clean, up-to-date CRM and honest, realistic probability ratings from your sales team.
Historical Forecasting
The historical forecasting model is probably the most straightforward of the bunch. At its core, it works on the assumption that your future will look a lot like your past. You simply look at your sales from a similar period—like this same quarter last year—and use that as a baseline.
For example, if your team closed $500,000 in Q2 of last year and you've been growing steadily at 10% year-over-year, your historical forecast for this Q2 would be $550,000. It's simple, fast, and works pretty well for stable businesses in predictable markets.
The biggest blind spot here, though, is that it completely ignores what's happening right now. It doesn't account for things like:
- Sudden shifts in market conditions
- A new competitor entering the scene
- Changes in your sales team's structure or performance
- The actual health of your current pipeline
Because of this, most teams use historical forecasting as a helpful benchmark to compare against other, more dynamic methods, rather than relying on it alone.
Pipeline-Based Forecasting
Think of pipeline-based forecasting as a more sophisticated and data-driven version of the bottom-up approach. This method digs into every single deal in your pipeline and applies a specific win probability based on its exact sales stage. It's a systematic way to turn your pipeline's potential into a concrete number.
Here’s a quick look at how the math breaks down:
This method is so effective because it takes a lot of the subjective guesswork out of the equation. Those win probabilities aren't just pulled from thin air; they should be based on your actual historical conversion rates from one stage to the next, which is data you can easily pull from a good B2B CRM.
The accuracy here is directly tied to how well-defined your sales stages are and how consistently your team uses them. When done right, it gives you a dynamic, real-time view of the revenue you can expect to hit.
Comparing Sales Forecasting Methods
Each of these methods offers a unique lens for viewing your future sales. There's no single "best" one; the ideal choice often involves blending two or more to get a more well-rounded picture. This table breaks down the core differences at a glance.
| Methodology | Core Approach | Best For | Key Challenge |
|---|---|---|---|
| Top-Down | Starts with the total market size and estimates the company's potential share. | New companies, new product launches, or entering new markets. | Can be overly optimistic and disconnected from current sales activities. |
| Bottom-Up | Aggregates individual deals and sales rep estimates from the pipeline. | Established B2B teams with a structured sales process and active pipeline. | Relies heavily on accurate rep judgment and clean CRM data. |
| Historical | Uses sales data from past periods to predict future performance. | Stable businesses in predictable markets with consistent growth patterns. | Ignores current market shifts, competition, and pipeline health. |
| Pipeline-Based | Applies historical win-rate percentages to deals based on their current stage. | Data-driven teams with a well-defined sales process and reliable CRM data. | Requires accurate and consistent tracking of stage-to-stage conversion rates. |
Ultimately, understanding these four approaches allows you to pick the right tool for the job. Many experienced sales leaders will create a pipeline-based forecast and then check it against a historical one to see if it passes the "sniff test."
How to Build Your First Sales Forecast Step-by-Step
Knowing the theory behind forecasting is one thing, but actually rolling up your sleeves and building one is another. It can feel a little daunting at first, but the process really just breaks down into a handful of logical, manageable steps.
This guide will walk you through creating a solid forecast from the ground up, turning those abstract ideas into a practical tool you can use to steer your business.
Remember, the goal isn't perfection on day one. It's about creating a repeatable process you can fine-tune over time. Think of it like building a muscle—the more you work it, the stronger and more accurate your forecasting will become.
Step 1: Define Your Sales Process and Stages
Before you can predict where you're going, you need a map of how you get there. A clearly defined sales process is the bedrock of any decent forecast, especially if you're using a pipeline-based method. Each stage in your process needs to represent a real, tangible milestone in a deal's journey.
Your stages have to be concrete, not wishy-washy. Vague labels like "In Progress" or "Follow-Up" just cause confusion. Instead, use action-oriented stages that signal a clear commitment from the customer.
Here’s a typical B2B sales process that works well:
- Lead Qualified: You've made contact and confirmed the prospect fits your ideal customer profile.
- Discovery Call Completed: You’ve had that initial chat to dig into their needs and pain points.
- Demo Presented: The prospect has actually seen your product or service in action.
- Proposal Sent: A formal quote or proposal is in the hands of the key decision-makers.
- Negotiation: You're actively hashing out the terms, pricing, or contract details.
- Closed Won / Lost: The deal is either officially signed or the prospect has walked away.
When you nail these definitions down in your CRM, your whole team is singing from the same hymn sheet. It ensures every single deal is categorized consistently.
Step 2: Gather Your Historical Data
Your past performance is your most valuable asset for predicting the future. Even if you’re a newer company, any data is better than none at all. The mission here is to pull together clean, relevant information that can act as a baseline.
Start by digging into your CRM for at least the last 12 months of data, if you have it. You'll want to focus on:
- The total deals won and lost each month or quarter.
- The average deal size for all your closed-won opportunities.
- Your average sales cycle length (how long it takes from that first "hello" to a signed contract).
- Conversion rates from one stage to the next in your sales process.
This data is your source of truth. It helps you calculate realistic win probabilities for each stage in your pipeline, cutting through the guesswork and gut feelings that can so easily throw a forecast off track.
This step really shines a light on the importance of good data hygiene. If your CRM is a mess, your forecast will be, too. It’s worth taking the time now to make sure everything is filled out correctly.
Step 3: Choose Your Forecasting Period
Next up, you need to decide on your timeframe. Are you looking ahead one month, one quarter, or the full year? The right cadence really depends on your business model and how long your sales cycle is.
- Monthly Forecasts: These are perfect for businesses with quick sales cycles, say under 30-45 days. This frequency lets you pivot fast and keeps the team focused on immediate targets.
- Quarterly Forecasts: This is the most common choice for B2B companies, especially those with sales cycles in the 2-6 month range. It gives you a strategic view without getting lost in the weeds of weekly ups and downs.
- Annual Forecasts: These are great for high-level planning, setting budgets, and mapping out long-term growth, but they aren't very practical for day-to-day sales management.
For most teams, a quarterly forecast that gets a refresh every month strikes the perfect balance between strategic planning and tactical agility.
Step 4: Select a Forecasting Model
Alright, you've got your process mapped out, your data in hand, and your timeframe set. Now it’s time to pick your method. For most B2B teams working out of a CRM, the pipeline-based forecasting model is the most practical and accurate place to start. It’s built on the real-time data you already have about your active deals.
To put this model into practice, you’ll assign a win probability to each stage of your sales process, pulling from the historical data you just gathered. For example, you might look back and see that deals in the "Proposal Sent" stage have historically closed 50% of the time. Simple as that.
The flowchart below shows how different methods tap into different data sources to come up with a number.
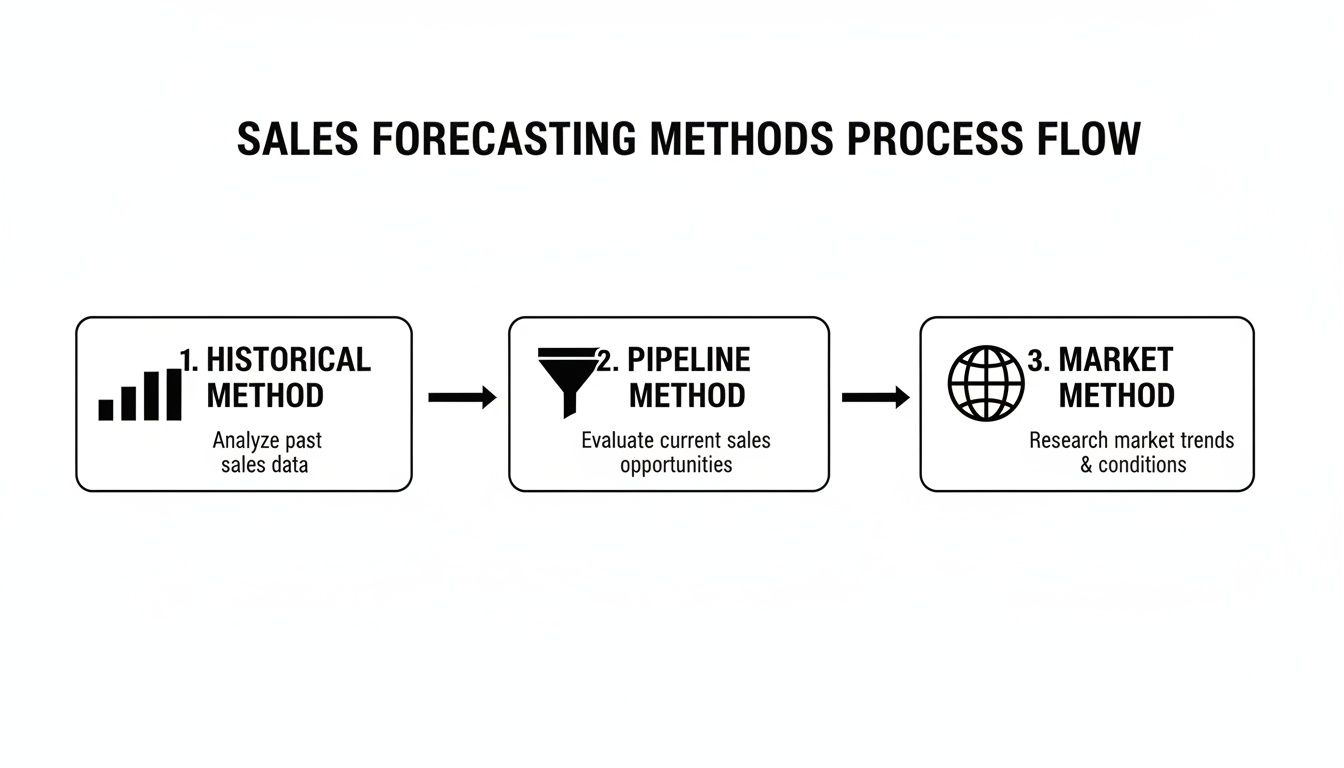
As you can see, each approach gives you a unique angle. That’s why many experienced teams actually blend a few methods together to get a more well-rounded picture. For a closer look with some hands-on worksheets, you should check out these different sales forecasting examples and templates.
Step 5: Monitor and Refine Continuously
Your first forecast isn’t the finish line—it’s the starting block. A sales forecast is a living, breathing document. It needs to be monitored and tweaked as new deals come in and old ones move along. Get a recurring forecast review meeting on the calendar. Weekly works well for fast-moving teams, while bi-weekly or monthly might be better for others.
In those meetings, you should be talking about:
- Progress Against the Forecast: How are we tracking against our prediction?
- Pipeline Movement: Which deals have moved forward? Which have stalled or died?
- Risks and Opportunities: What potential roadblocks have popped up? Any big wins on the horizon?
- Rep-Level Commitments: Go around the room and ask each rep which deals they are truly confident will close in the period.
By constantly comparing your forecast to what actually happens, you'll start to spot patterns and learn where your assumptions were off. This constant feedback loop is what makes a forecast truly reliable over time, turning it from an educated guess into a powerful compass for your business.
The Key Metrics for an Accurate Sales Forecast
A sales forecast is only as reliable as the data you feed it. Think of it like a chef’s signature dish—the final result lives or dies by the quality of the ingredients. For sales leaders, those ingredients are a handful of essential metrics that show you the real health and momentum of your pipeline.
Tracking these numbers isn’t about micromanagement. It’s about gaining clarity. When you focus on the right data points, you can move past gut feelings and build a forecast grounded in actual evidence. It turns a hopeful guess into a reliable business compass.
Core Metrics That Drive Your Forecast
To figure out what your team is likely to close, you have to break down your sales pipeline into its core components. These four metrics are the pillars of an accurate, data-driven forecast, and they should be front and center on your B2B CRM dashboard.
- Total Pipeline Value: This is pretty straightforward—it's the total dollar value of all open opportunities in your sales funnel. While it’s a high-level number, it gives you the best-case-scenario view of your potential revenue if every single deal were to close.
- Average Deal Size: You get this by dividing your total revenue from won deals by the number of deals you won in that period. Knowing your average helps you understand how many deals you realistically need to hit your target.
- Sales Cycle Length: This is the average time it takes for a lead to become a signed contract. It’s a critical piece of the puzzle for knowing which opportunities have a legitimate chance of closing within the current forecasting period.
- Conversion Rate by Stage: This is the percentage of deals that actually move from one stage of your sales process to the next. It’s easily the most powerful metric for calculating the weighted, or most likely, value of your pipeline.
By keeping an eye on these core figures, you create a feedback loop that constantly fine-tunes your predictions. For a deeper dive, check out our guide for more examples of important sales performance metrics to track.
Establishing a Forecasting Cadence
A forecast isn't something you create once and file away. It's a living, breathing tool that needs regular attention. Setting up a consistent review cadence creates a rhythm of accountability and helps your team adapt to changes on the fly. The right frequency really just depends on your sales cycle.
- Weekly: This is a good fit for teams with short sales cycles (under 45 days) where deals are opening and closing fast.
- Monthly: The most common cadence for B2B teams, especially those with sales cycles of 2-6 months.
- Quarterly: This works for high-level strategic planning, but it’s too infrequent on its own. It should always be paired with more regular check-ins.
The goal of a forecast review isn’t to put every decision under a microscope. It’s a collaborative meeting to spot risks, celebrate wins, and make sure everyone is aligned on how to hit the company’s revenue goals.
During these meetings, pull up your CRM dashboard and look for trends. Is the pipeline value growing? Is the sales cycle shrinking? These insights help you get ahead of problems before they can derail your quarter.
Using Data to Benchmark Performance
Understanding your internal numbers is step one, but it’s also incredibly helpful to see how you stack up against the wider market. For instance, data from the U.S. Census Bureau showed Q3 retail e-commerce sales hit $310.3 billion, which was 16.4% of total retail sales.
At the same time, forecasts predicted overall retail sales growth across the US (1.5%), Western Europe (3.0%), and China (3.8%). For managers at small and mid-sized businesses, having stats like these accessible in a CRM provides a crucial benchmark for pipeline health and growth targets. You can dig into these economic indicators in the full Census Bureau report. This kind of external context helps you set far more realistic and informed sales forecasts.
Here's the rewritten section, designed to sound completely human-written and natural.
Common Forecasting Pitfalls and How to Avoid Them
Even the most buttoned-up sales teams can stumble into common forecasting traps. These mistakes might seem minor at first, but they have a nasty habit of snowballing, leading to missed targets and shaky strategic decisions. Knowing what to watch out for is half the battle.
Think of your forecast less as a "set it and forget it" document and more as a living, breathing tool. It needs regular attention to stay healthy. By sidestepping these all-to-common issues, you can turn your forecast from a hopeful guess into a reliable map for your business.
Overly Optimistic Reps
We've all been there. A rep has a fantastic call, the demo goes perfectly, and they're convinced the deal is in the bag. This is the classic case of "happy ears," where optimism clouds reality. A great conversation is wonderful, but it doesn't always equal a signed contract this quarter.
What Not To Do: Don't just take a rep's "commit" at face value. When you build a forecast on gut feelings, you're building it on sand.
What To Do Instead: Ground every forecast in cold, hard facts. During your pipeline reviews, dig deeper with questions like, "What specific buying signals have you seen? Did they introduce you to the decision-maker?" Lean on the historical data in your CRM to see what the real win rate is for deals at this stage.
Messy and Inconsistent CRM Data
Your forecast is a direct reflection of the data you feed it. If your CRM is a digital junkyard of old opportunities, duplicate contacts, and inconsistently named deal stages, your forecast will be garbage. Data hygiene isn't just busywork—it's the bedrock of a reliable forecast.
Poor data quality isn't just an annoyance; it's expensive. Studies have shown it can cost companies 15% to 25% of their revenue. For forecasting, that translates into bad projections that lead to poor hiring decisions and misallocated budgets.
What To Do Instead: You have to get strict about data standards. It's non-negotiable.
- Set the expectation: Reps must update their deals right after a significant client interaction. No excuses.
- Define your stages: Make sure everyone on the team understands exactly what "Proposal Sent" means and what criteria a deal must meet to move there.
- Automate what you can: Use your CRM to automatically log calls and emails. The less manual entry, the fewer mistakes.
Ignoring Historical Trends and Seasonality
Forecasting based only on your current pipeline is like trying to drive a car by only looking out the front windshield. You're missing critical context. Most businesses have a natural rhythm—a busy season, a slow summer, a Q4 rush. Ignoring these patterns is asking for trouble.
What Not To Do: Don't build your forecast in a bubble, assuming this quarter will be just like the last. You're throwing away valuable insights from your own history.
What To Do Instead: Use your past performance as a reality check. Pull up the numbers from this same time last year. Does your current forecast seem way off? If you’re projecting massive growth compared to last year's slow season, you better have a very good reason why. Blending what's in your pipeline now with what's happened before is the key to a balanced, realistic number.
Using Your B2B CRM for Smarter Forecasting
If you're still forecasting with spreadsheets and a healthy dose of guesswork, it's time for a change. Your B2B CRM is the engine that drives a truly reliable sales forecast, transforming raw data into a clear strategic advantage. Think of it as your single source of truth, where every deal, email, and customer interaction connects directly to your bottom line.
A CRM designed for B2B sales doesn't just hold onto information; it makes it useful. Visual sales pipelines, for instance, make bottom-up forecasting a breeze. Instead of hounding reps for updates, managers can see the stage of every single opportunity at a glance and get a real-time pulse on the health of the entire pipeline.
This clarity is a game-changer for sales leaders. It lets them coach more effectively by easily spotting stalled deals, pinpointing what top performers are doing right, and offering help exactly where it's needed. For the reps themselves, it means they can manage their own pipeline with total confidence, knowing precisely what needs to happen to crush their targets.
Turning Data Into Decisions
A powerful CRM handles the tedious, manual data entry that nobody likes, ensuring the information you’re basing your forecasts on is actually accurate. This frees up your team to do what they do best: sell.
What you get is a dynamic forecasting process built on a rock-solid foundation. Live dashboards give you an instant snapshot of performance against your goals, which makes your forecast review meetings far more productive. This is especially vital as markets grow—worldwide ecommerce sales, for example, are expected to jump from $6.42 trillion to $7.89 trillion. You can find more data on this global expansion over on Shopify's blog.
A well-managed CRM transforms forecasting from a quarterly chore into an ongoing strategic conversation. It gives leaders the confidence to make critical decisions about hiring, budgeting, and growth based on reliable, up-to-the-minute data.
Ultimately, your CRM is where your sales forecast stops being a number and starts being a plan. By having all your data in one place, you can move past simple predictions and tap into more powerful methods. To see what's next, check out our guide on how predictive sales AI is shaping the future of forecasting.
Got Questions About Sales Forecasting? We've Got Answers.
We've covered a lot of ground, but you might still have a few questions rattling around. Let's clear up some of the most common ones so you can start forecasting with confidence.
How Often Should We Update Our Sales Forecast?
There's no single right answer here—it really hinges on how long your sales cycle is.
If you're in a business with fast-moving deals (think under 30 days), a weekly forecast review is your best bet. It keeps everyone sharp and allows you to pivot quickly. For those of us in the B2B world with longer cycles (say, 3-6 months), checking in every other week or once a month is usually plenty.
The key isn't the specific frequency, but the consistency. Your CRM dashboard gives you a live look anytime, but scheduling a formal review is non-negotiable. It's your dedicated time to spot trends, adjust your course, and catch problems before they blow up the quarter.
Your sales forecast isn't a "set it and forget it" report; it's a living, breathing document. Regular check-ins turn it from a good guess into a strategic weapon.
What's the Real Difference Between a Sales Forecast and a Sales Goal?
This one's simple when you think about it like a road trip. Your sales goal is the dream destination you plug into the map. Your sales forecast is the GPS telling you if you'll actually get there on time.
- A sales goal is what you want to happen. It's the big, ambitious number you're aiming for, like hitting $2 million in new revenue. It’s meant to push and motivate the team.
- A sales forecast, on the other hand, is what's likely to happen. It's grounded in reality—your current pipeline, past performance, and rep activity. It’s the data-driven reality check that keeps your ambition in check.
You need both, but you can't mistake one for the other.
Can I Get By Without a CRM for Sales Forecasting?
Technically, yes. You could build a forecast in a spreadsheet. But honestly, it’s a painful, manual process that’s just begging for mistakes.
As soon as you have more than a couple of reps, trying to keep a spreadsheet updated with every deal stage, every call, and every email is a nightmare. It quickly becomes a mess of outdated information.
A good B2B CRM handles all the heavy lifting for you. It pulls all your data into one place, gives you instant insights, and cuts out the human error. Your forecast becomes more accurate, the process is faster, and you can actually scale it as you grow.