A sales process flowchart is simply a map. It's a visual guide that lays out the exact path a prospect should follow to become a happy customer, breaking the entire sales cycle down into clear, manageable stages with specific actions for your team to take. Think of it as your team’s playbook for turning interest into revenue, ensuring everyone is on the same page.
Why Your Sales Process Feels Chaotic and How a Flowchart Fixes It
Let's be honest, managing a B2B sales pipeline can often feel like herding cats. Deals stall out of nowhere, new reps seem to be making up their own rules, and trying to forecast revenue feels more like a guessing game than a science. When you don't have a standardized system, your team is running on gut feelings and personal habits—a recipe for inconsistency that's impossible to scale.
This is exactly where a sales process flowchart steps in to bring order to the chaos. It’s the tool that shifts your team from inconsistent guesswork to a unified, repeatable system. This visual roadmap is far more than just a bunch of boxes and arrows; it's a strategic agreement on the precise steps, criteria, and handoffs required to consistently move a qualified buyer from that first "hello" to a signed contract.

From Inconsistency to Predictability
When every salesperson has their own unique way of doing things, you completely lose sight of what actually works. A flowchart changes that by creating a single source of truth. It establishes a common language and a standardized process for the entire team. This clarity brings some powerful, immediate benefits:
- Faster Onboarding: New hires get up to speed in weeks, not months, because they have a proven path to follow from day one.
- Improved Forecasting: With defined stages and clear exit criteria for each deal, your sales forecasts suddenly become much more accurate and reliable.
- Better Alignment: Finally, sales, marketing, and customer success can all rally around a single, documented customer journey.
Let's look at why this structure is so critical right now. The average B2B sales cycle has ballooned to roughly 84 days. On top of that, a recent study found that 75% of B2B buyers admit they are taking longer to make purchasing decisions than they did just a year ago. A well-defined flowchart is your best defense against this complexity, ensuring no crucial steps are missed during those long evaluation periods.
A flowchart isn't about boxing in your top performers. It's about capturing what makes them successful and turning those habits into a playbook that raises the game for the whole team. It’s how you build a predictable revenue engine.
Solving Tangible Problems in Your Pipeline
Let’s get practical. A good flowchart doesn’t just look nice on a whiteboard; it actively solves the real-world problems that kill deals and waste time. It gives you a clear framework for how to manage a sales pipeline, translating abstract goals into concrete actions. By mapping the journey visually, you can instantly see where deals are getting stuck and figure out why.
For example, do you find that a lot of opportunities go cold right after the initial demo? Your flowchart can help diagnose the issue. Maybe reps aren't setting clear next steps, or perhaps a key piece of follow-up collateral is missing. The flowchart makes these bottlenecks obvious, allowing you to fix them, shorten your sales cycle, and improve conversion rates.
To put it in perspective, here's a look at some common sales headaches and how a flowchart provides a direct solution.
Common Sales Headaches and Flowchart Solutions
| Common Sales Challenge | How a Flowchart Provides the Solution |
|---|---|
| Inconsistent Rep Performance | Standardizes the "winning" process, giving every rep a proven playbook to follow for better, more consistent results. |
| Inaccurate Sales Forecasts | Defines clear exit criteria for each stage, so deals only advance when they're truly qualified, making your pipeline data reliable. |
| Deals Stalling in the Pipeline | Visually highlights bottlenecks, making it easy to identify where deals are getting stuck and diagnose the root cause. |
| Long Ramp-Up Time for New Hires | Provides a clear, step-by-step guide to the sales process, helping new team members become productive much faster. |
| Poor Alignment with Marketing | Creates a shared understanding of the customer journey, defining when a lead is "sales-ready" and ensuring smoother handoffs. |
Ultimately, a flowchart acts as the central nervous system for your sales organization, connecting individual actions to the larger goal of predictable revenue growth.
Laying the Groundwork: Defining Your Core Sales Stages
Before you even touch a flowchart tool, we need to get the foundation right. This all starts with mapping out the core stages of your sales journey. And here's the trick: these stages shouldn't be based on your internal lingo, but on how your customers actually decide to buy something.
So many sales teams get stuck using vague, generic stages like "Prospecting" or "Follow-Up." What do those even mean? They tell you nothing about a deal's health or what you should do next.
The real goal is to create distinct, meaningful milestones. Every single stage in your flowchart needs to represent a real step forward for the buyer, marked by a clear, verifiable action. When a deal moves from Stage 2 to Stage 3, it should mean the prospect has made a tangible commitment, not just that a rep fired off another email.
Moving Past Generic Stage Labels
Generic stage names are the enemy of a clear process and a reliable pipeline.
Think about a stage called "Qualification." For one rep, that might mean a quick five-minute chat. For another, it means they’ve confirmed budget, authority, need, and timeline. That kind of inconsistency makes your pipeline data pretty much useless for forecasting.
Let's get specific. Build your stages around concrete outcomes and decision points. What does a customer do that signals they're getting serious?
- Instead of "Prospecting," try something like "Initial Connection Made." The exit criteria? A discovery call is officially booked on the calendar.
- Instead of a fuzzy "Qualification" stage, break it down. You could have "Discovery Call Held" and then "Solution Fit Confirmed," each with its own non-negotiable checklist.
This shift forces you to define what absolutely must happen for any deal to advance. It’s the difference between a pipeline built on hope and one built on hard evidence.
The best sales stages aren't defined by what your sales team does, but by what your buyer commits to doing. A scheduled demo is a commitment. An introduction to a key decision-maker is a commitment. These are the solid building blocks of a process you can actually trust.
Creating Clear Entry and Exit Criteria
This is where the magic really happens. The true power of a well-defined sales process is in its entry and exit criteria.
For every stage you map out, you have to document two things:
- What must be true for a deal to enter this stage?
- What specific action must happen for it to exit and move to the next one?
This simple step removes all the guesswork and ensures every single rep is running the same playbook.
Let’s take that "Solution Fit Confirmed" stage. The criteria might look something like this:
- Entry Criteria: A discovery call was completed and logged in the CRM.
- Exit Criteria: The prospect has confirmed their main pain points, agrees your solution can solve them, and has introduced you to at least one other person involved in the evaluation.
Using a proven qualification framework gives you a fantastic structure for this. Frameworks like BANT (Budget, Authority, Need, Timeline) or the more in-depth MEDDIC (Metrics, Economic Buyer, Decision Criteria, Decision Process, Identify Pain, Champion) are perfect for building these decision gates. For example, a deal can't leave the "Technical Validation" stage until the "Decision Criteria" and "Metrics" from MEDDIC are fully understood and documented.
Tailoring Stages to Your Business Model
Your sales stages have to reflect how you actually sell. The process for a quick, transactional hardware sale is going to look completely different from a complex, long-cycle enterprise SaaS deal. One size definitely does not fit all.
Take a look at how different they can be:
| Aspect | Transactional Hardware Sale | Enterprise SaaS Sale |
|---|---|---|
| Sales Cycle | Days to weeks | Months to over a year |
| Key Stages | Lead > Quote Sent > Order Placed | Discovery > Stakeholder Mapping > Technical Validation > Business Case > Legal Review > Closed Won |
| Decision-Makers | 1-2 individuals (e.g., IT Manager) | 6-10 stakeholders (e.g., IT, Finance, Legal, End-Users) |
| Example Exit Criteria | Prospect confirms product specs and requests a formal quote. | The tech lead signs off on a Proof-of-Concept (POC) and your champion presents the business case to the economic buyer. |
The hardware company's flowchart would be short and linear, all about speed and efficiency. The enterprise SaaS company? Their flowchart would need more stages, maybe even parallel tracks for technical and business validation happening at the same time.
The key is to map a process that mirrors the real-world steps your ideal customer takes. When you do that, your team is perfectly aligned with their journey, from the first hello to the final signature.
Mapping the Actions and Decisions That Move Deals Forward
Okay, you've got your core sales stages outlined. That's a great start, but it's just the skeleton. Now, we need to add the muscle—the specific actions, stakeholder touchpoints, and critical decision points that actually guide your reps and move deals from one stage to the next. This is where we turn a high-level map into an actionable playbook.
Think of it like this: your sales stages are the major cities on a road trip. The actions and decisions we're mapping now are the turn-by-turn directions, the scheduled fuel stops, and the scenic routes that get your team to the destination efficiently. Without this detail, reps are just guessing how to get from "Discovery" to "Solution Presented," and they'll almost certainly take some costly detours.
The idea is to document every single meaningful interaction that pushes a deal forward. These are your critical touchpoints, and they can look very different depending on how complex your sales cycle is.
This flowchart breaks the process down to its three most fundamental parts: discovery, qualification, and building the solution.
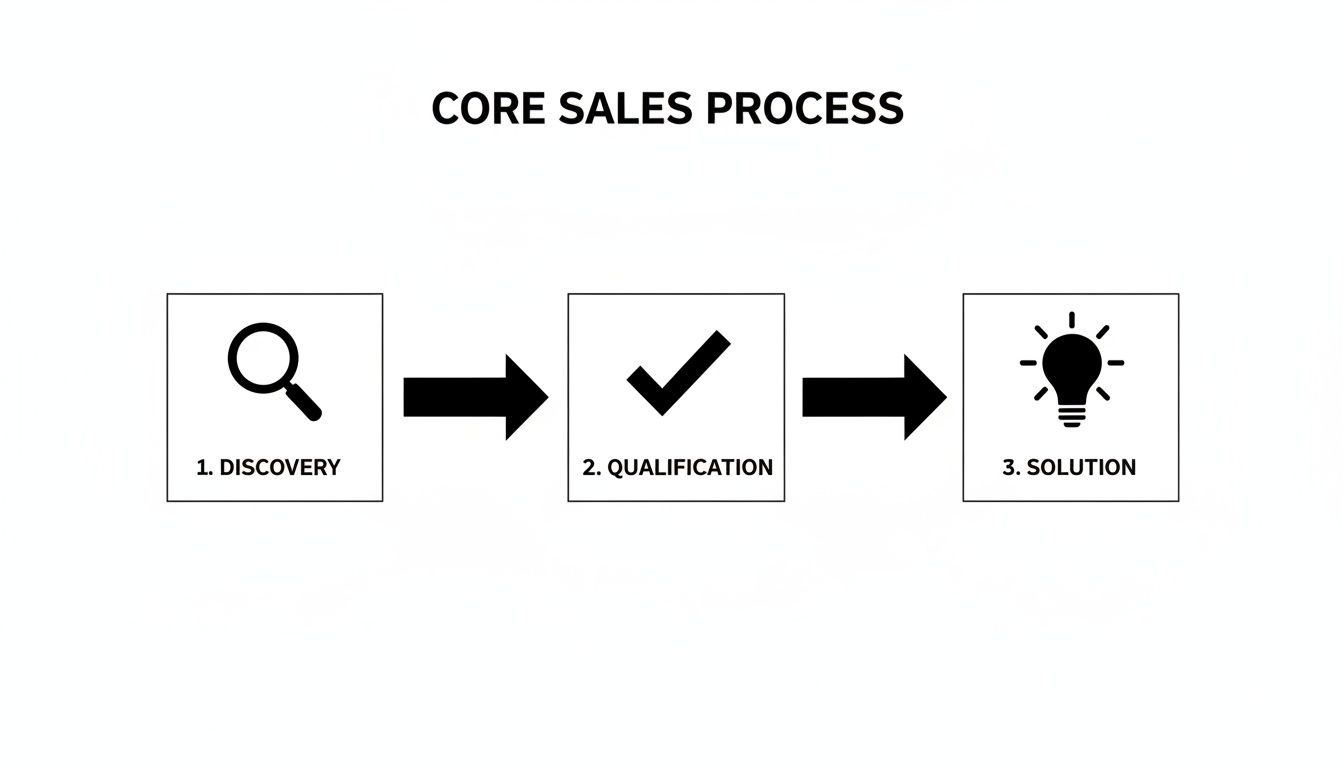
This visual shows how each phase logically builds on the last, creating a clear path for a prospect to move through the funnel.
Identifying Key Decision Gates
Let's be real: not all actions carry the same weight. Some moments in your sales cycle are pivotal because they represent a big commitment of time and resources from your team. We call these decision gates—checkpoints where a deal has to be officially validated before it can move on.
A decision gate is simply a "go/no-go" point. It exists to stop your team from wasting precious resources—like a solutions engineer's time on a demo—for a prospect who isn't a serious, qualified buyer. Putting these gates in place isn't just about discipline; organizations with a formal sales process see a 28% increase in revenue.
Here are a few classic examples of decision gates I've seen work wonders:
- Technical Demo Gate: Before a solutions engineer even gets on the calendar, the account executive must have a signed-off mutual action plan from the prospect. No plan, no demo.
- Proposal Gate: A proposal isn't written until the rep has confirmed the prospect's entire decision-making process, including who the real economic buyer is.
- Pilot or POC Gate: To kick off a proof-of-concept, the prospect has to agree in writing to predefined success criteria. This avoids the dreaded "we'll just try it out" scenario that goes nowhere.
These gates force deals to advance based on real buyer commitment, not just a rep's happy ears.
Defining Roles and Responsibilities
One of the most common reasons deals stall is simple confusion: nobody knows who is supposed to do what, and when. Your flowchart needs to spell this out crystal clear, defining the roles and responsibilities at every step. This eliminates the "I thought you were doing that" problem and ensures smooth handoffs.
In a typical B2B sale, you've got a whole cast of characters:
- Sales Development Rep (SDR): Kicks things off with outreach and books that first discovery call.
- Account Executive (AE): Owns the deal, from leading discovery to presenting the solution and negotiating the contract.
- Solutions Engineer (SE): The technical expert who handles the deep-dive demo and answers the tough product questions.
- Legal Team: Jumps in to review and redline the final contract.
Your flowchart should essentially function as a RACI chart (Responsible, Accountable, Consulted, Informed) for your sales cycle. When everyone knows their part, the entire machine runs more smoothly, and the customer has a much better experience.
By mapping this out visually, you prevent crucial tasks from falling through the cracks. For instance, the flowchart might show an arrow from "Technical Demo Completed" pointing right back to the AE with a specific action item: "AE to schedule follow-up and confirm business value with economic buyer within 24 hours." This creates immediate accountability and keeps the deal's momentum alive. When you get this granular, your flowchart stops being just a guide and becomes a powerful tool that actively helps you win more deals.
Bringing Your Flowchart to Life in Your CRM
A flowchart taped to the wall is a good starting point, but let's be honest, it’s just a picture. The real magic happens when that visual map becomes a living, breathing part of your team's daily grind inside your Customer Relationship Management (CRM) platform.
This is where your diagram stops being a passive guide and starts being an active engine. It guides reps, enforces best practices, and—best of all—automates the tedious stuff. This is the crucial link between your sales strategy and what actually happens on the front lines.
Aligning Flowchart Stages with Your CRM Pipeline
First things first: your CRM's sales pipeline needs to be a perfect mirror of the stages you mapped out. If your flowchart has a "Technical Validation" stage, your CRM pipeline needs a "Technical Validation" stage. Simple as that.
This one-to-one alignment is more than just good housekeeping; it's the foundation for reliable data and accurate forecasting. When a rep drags a deal from one column to the next in the CRM, they are physically moving it along the process you designed.
From there, you can start enforcing those decision gates you worked so hard to define. For instance, if your flowchart says a deal can't move to the "Proposal Sent" stage without a confirmed "Economic Buyer," you just make that a required field in your CRM. Problem solved. This small tweak forces compliance and makes sure reps don't skip critical steps. You've now made the right way the easy way. For more on getting the technical side right, you can find in-depth advice on how to implement a CRM system that supports this level of customization.
Using Your Flowchart as an Automation Blueprint
Now for the fun part. Your flowchart is no longer just a diagram; it's a playbook for your CRM's automation engine. Every single action, decision, and transition point you mapped out is a potential trigger for some slick automation.
Think about all the repetitive tasks your team handles. Many of them can be completely automated based on where a deal is in your process.
This isn't just a minor efficiency hack. The rise of AI in sales is changing how teams operate. It’s expected that soon, most B2B sales conversations will happen through digital channels, which opens up huge opportunities for intelligent automation.
Here are a few real-world examples you can set up based on your flowchart's logic:
- Smart Task Assignment: A deal moves to "Demo Booked." Boom—a "Prepare for Demo" task is automatically created and assigned to a solutions engineer.
- Automated Nudges: A deal has been sitting in "Proposal Sent" for five days with no movement. The CRM automatically kicks off a gentle follow-up email sequence.
- Instant Data Enrichment: The moment a new lead hits the "Qualification" stage, a workflow triggers to pull in additional company and contact data from your enrichment tool.
Your flowchart isn't just a map of what to do; it's a command list for your CRM's automation engine. Every arrow and decision diamond in your diagram can be translated into a "when this happens, do that" rule.
This approach stops leads from falling through the cracks and, more importantly, frees up your reps to do what they do best: building relationships and closing deals.
From Flowchart Event to CRM Automation
Here’s a practical table showing how specific flowchart events can trigger powerful automated actions in your CRM.
| Flowchart Stage/Event | Example CRM Automation Trigger |
|---|---|
| New Lead Assigned | An automated welcome email is sent from the assigned rep, and a "First Touch" task is created and due in 24 hours. |
| Deal Moves to "Technical Validation" | A notification is automatically sent via Slack to the solutions engineering team channel, alerting them of a pending demo request. |
| Deal Stage is "Contract Negotiation" | A private record is automatically created and shared with the legal team, giving them access to all deal notes and contacts. |
| Deal is Marked "Closed Lost" | A "Reason for Loss" field becomes mandatory, and the contact is automatically added to a long-term nurturing campaign. |
These are just a few ideas, but they show how your defined process can become an active, automated assistant for your sales team.
Building Reports to Track Your New Process
Finally, your CRM is where you prove that your new process actually works. With your stages and decision gates built-in, you can now create dashboards that give you a live, honest look at the health of your sales motion.
You'll want to build reports that track a few key things:
- Conversion Rate by Stage: Where are deals getting stuck? This immediately points to bottlenecks in your flowchart.
- Average Time in Stage: How long are deals lingering in the proposal stage? This helps you spot and fix inefficiencies.
- Sales Cycle Length: Is the new process actually helping you close deals faster? The data will tell the story.
By keeping an eye on these metrics, you can see exactly where your process is winning and where it needs a tune-up. This data-driven feedback loop is what turns your flowchart from a one-and-done project into a system for continuous, predictable growth.
Choosing the Right Tools for the Job
Building a sales process flowchart doesn't mean you need to invest in a complicated or pricey software suite. Honestly, the best tool is the one your team will actually open and use every single day. Always prioritize clarity and adoption over a long list of features you'll never touch.
Your options really boil down to three main categories. Each has its own sweet spot, so the trick is to match the tool to where your team is right now—both in terms of needs and technical comfort. You don't want to over-engineer this from the get-go.
Dedicated Diagramming Tools
If you're looking for maximum flexibility and a space for your team to collaborate in real-time, dedicated diagramming tools like Miro or Lucidchart are fantastic. These platforms are built for exactly this kind of visual thinking. Their drag-and-drop interfaces make creating and tweaking your flowchart a breeze, which is perfect for those initial brainstorming sessions.
- What's great: They're highly flexible, packed with features, and designed for teamwork.
- The downside: They exist outside your CRM. That means you'll have to manually update your flowchart to keep it aligned with what's happening in your pipeline.
- Who they're for: Teams that need a powerful visual canvas to design the process from scratch and run collaborative workshops.
Built-in CRM Process Builders
Many modern CRMs—think big players like Salesforce or HubSpot—come with their own process builders. The massive advantage here is that your flowchart lives right inside the system your reps are using all day, every day.
This direct integration is a game-changer. You can tie flowchart stages directly to your sales pipeline, trigger automations, and make the process a living, breathing part of your team's workflow. If you're exploring this route, looking into options for customized CRM software can uncover some surprisingly powerful and native process-building features.
A little advice from my own experience: start simple. You can always move to a more advanced tool later. Getting your process documented and adopted in a basic tool is a thousand times more valuable than having a "perfect" flowchart in a complex system nobody ever looks at.
Simple, No-Cost Options
Never underestimate the power of the basics, especially when you're just starting out. A straightforward program like Google Drawings or even a well-structured spreadsheet can be more than enough to map out the first version of your process. These tools are free, everyone knows how to use them, and there's virtually no learning curve.
This kind of accessibility has fueled a huge expansion in the market for visual documentation. The global demand for flowchart and diagramming software has grown significantly, showing just how essential these visual aids have become for businesses of all stripes. You can dig into recent market reports to see just how big this trend has become.
Turning Your Flowchart Into a Living Playbook, Not a Dusty File
This is where so many teams drop the ball. They spend hours crafting the perfect sales process flowchart, present it with a lot of fanfare, and then it gets buried in a shared drive, never to be seen again. If you want to avoid that fate, you have to treat your flowchart as a living, breathing playbook that’s part of your sales culture.
The rollout itself is just as critical as the design. You can't just send a memo and hope for the best. Real adoption comes from hands-on training where reps can actually walk through the new stages and ask tough questions. You also need an open and easy way for them to give feedback—a dedicated Slack channel works great for this. It gives the team a sense of ownership and lets them flag issues as they happen in the real world.
Don't Set It and Forget It
Let's be realistic: a flowchart you build today will be stale in six months. Markets shift, products evolve, and customer profiles change. Your sales process has to keep up. The trick is to build a system for regular check-ins and updates.
Your CRM is your single source of truth here. Digging into the data will show you exactly where the process is working and where it’s breaking down. Pay close attention to two key metrics:
- Stage-to-Stage Conversion Rates: Seeing a huge number of deals die in the "Technical Validation" stage? That’s a massive red flag. It’s a sign that your qualification is off or your demo isn't hitting the mark.
- Average Sales Cycle Length: Is your deal cycle getting longer? If one particular stage is suddenly taking weeks longer than you planned, you’ve found a bottleneck that needs to be fixed right away.
The goal isn't a perfect process from day one. It's about building a process that gets smarter over time. Think of your flowchart as a dynamic tool that adapts based on what the data and your team are telling you.
Build a Rhythm of Review
To make this a reality, put a formal review of your sales process on the calendar every single quarter. This can't be a top-down lecture. Get the whole sales team in a room—your A-players, your new hires, everyone—and have a frank conversation.
Let the CRM data lead the discussion. Ask pointed questions like, "Why are we losing so many deals right after sending the proposal?" or "What's holding up the process between the first demo and the legal review?"
This collaborative approach keeps the flowchart grounded in reality and ensures it's respected by the people who rely on it every day. By making this review cycle part of your team's culture, you guarantee your flowchart stays a powerful playbook instead of just another forgotten file.
Got Questions? We've Got Answers
When sales leaders start mapping out their first flowchart, a few common questions always pop up. Getting these sorted out early is the key to creating a tool your team will actually use, not just another document that collects digital dust.
Let's dig into some of the most frequent ones.
How Often Should We Update Our Sales Process Flowchart?
As a rule of thumb, I recommend a quick health check every quarter and a deeper dive once a year. This keeps the process fresh without constantly yanking the rug out from under your team.
That said, you should immediately revisit your sales process flowchart after any major business change. Think of triggers like:
- Launching a new product or service
- Pushing into a new market
- Shifting your ideal customer profile
- Rolling out a major new sales tool (like a CRM or sales engagement platform)
Your flowchart should be a living, breathing guide. It needs to reflect how your team wins deals today, not how they did it six months ago.
The biggest mistake I see? Leadership builds the flowchart in a conference room without talking to the reps on the front lines. A process that ignores the real-world chaos of a sales call is doomed from the start and will get zero adoption.
Is This Really Necessary for a Small Sales Team?
Yes, one hundred percent. I'd argue it’s even more critical for a small team.
When you only have two or three reps, a solid flowchart creates the foundation you need to scale. It means your fourth, fifth, and tenth hires will learn a proven system, not just random "tribal knowledge" from whoever is sitting next to them.
It builds good habits and consistency right from the start. This makes it way easier to figure out what’s working (and what’s not) as you grow. A clear process is your blueprint for predictable revenue.